I tracked every hour of 2025: what 5,952 hours of personal time data showed me

František Hlinka · Solo developer of Nanominute
· 5 min read
In 2025 I logged almost every minute of my regular days with a timer: 5,952 hours of personal time data across 248 days. I stopped the timer only for travel, multi-day events and when I was sick. This post is the full picture of how I did it, what the numbers say, and what I changed because of them.
Why did I track my time for a whole year?
On some evenings I felt like I had done nothing all day, and I could not say where the time went. Tracking gave me an answer for every single day. It also makes me more intentional about my day: every time I start a timer I have to decide “this is what I’m going to do now”, and that small piece of mental work is the point. And, honestly, having the data is just cool.
How did I track everything I did?
I used a timer and logged the primary thing I was doing at any moment. When I was with friends and also having a meal, I logged it as Social, because that was the main thing. This biases the data a little towards big categories, but it is the only way I found to keep tracking simple enough to do daily.
My setup was Toggl Track, an iPhone app called Timery, and an Apple Shortcut. A widget on my lock screen showed my list of timers, so switching activity took under two seconds. I describe the whole setup, and what annoyed me about it, in Can you use Toggl Track for personal time tracking?
Where did my 5,952 hours go?
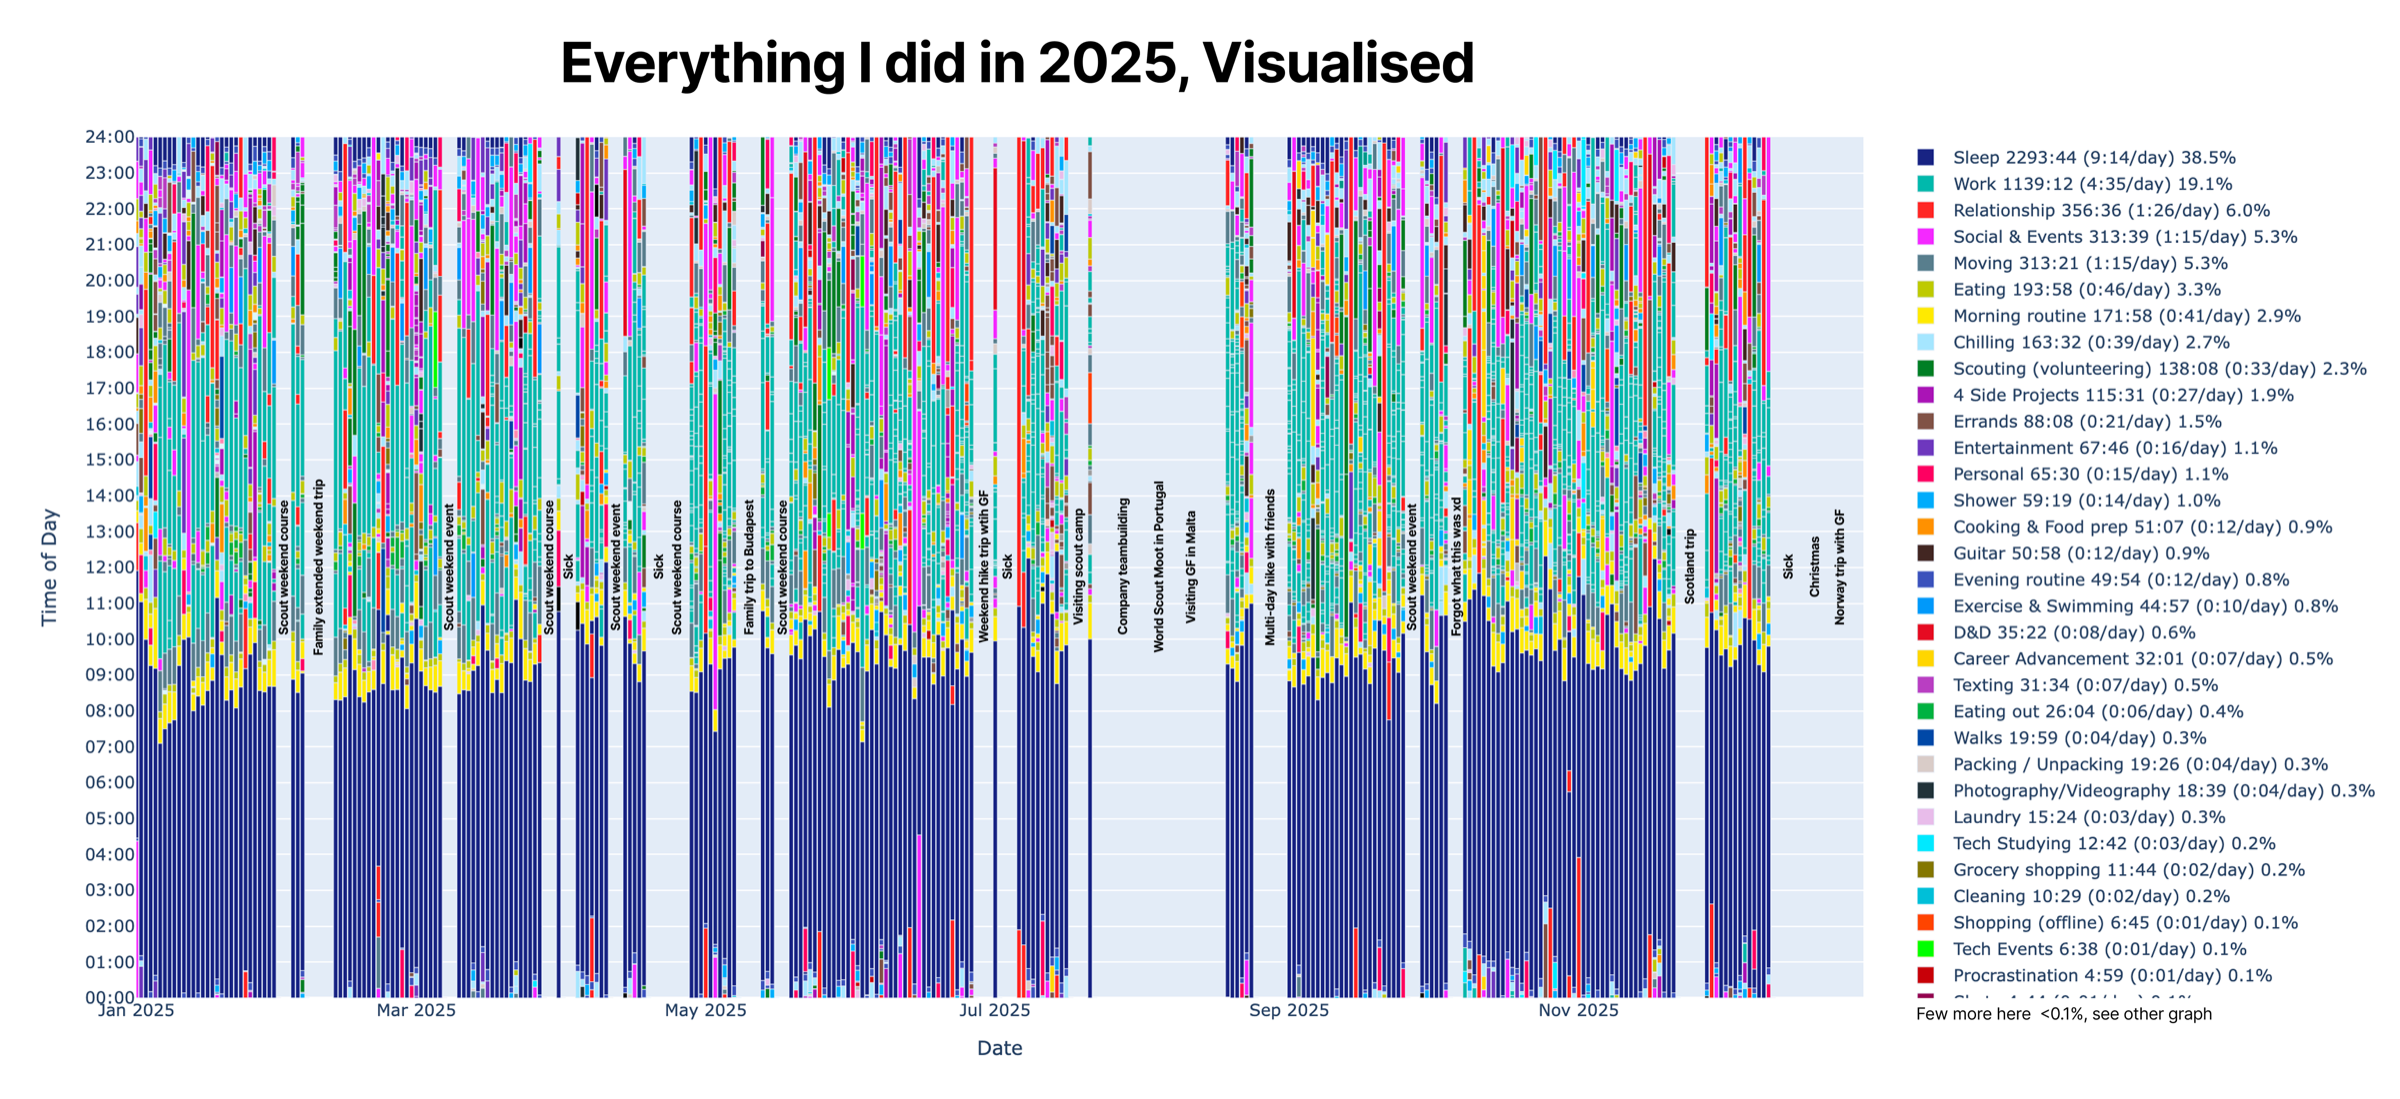
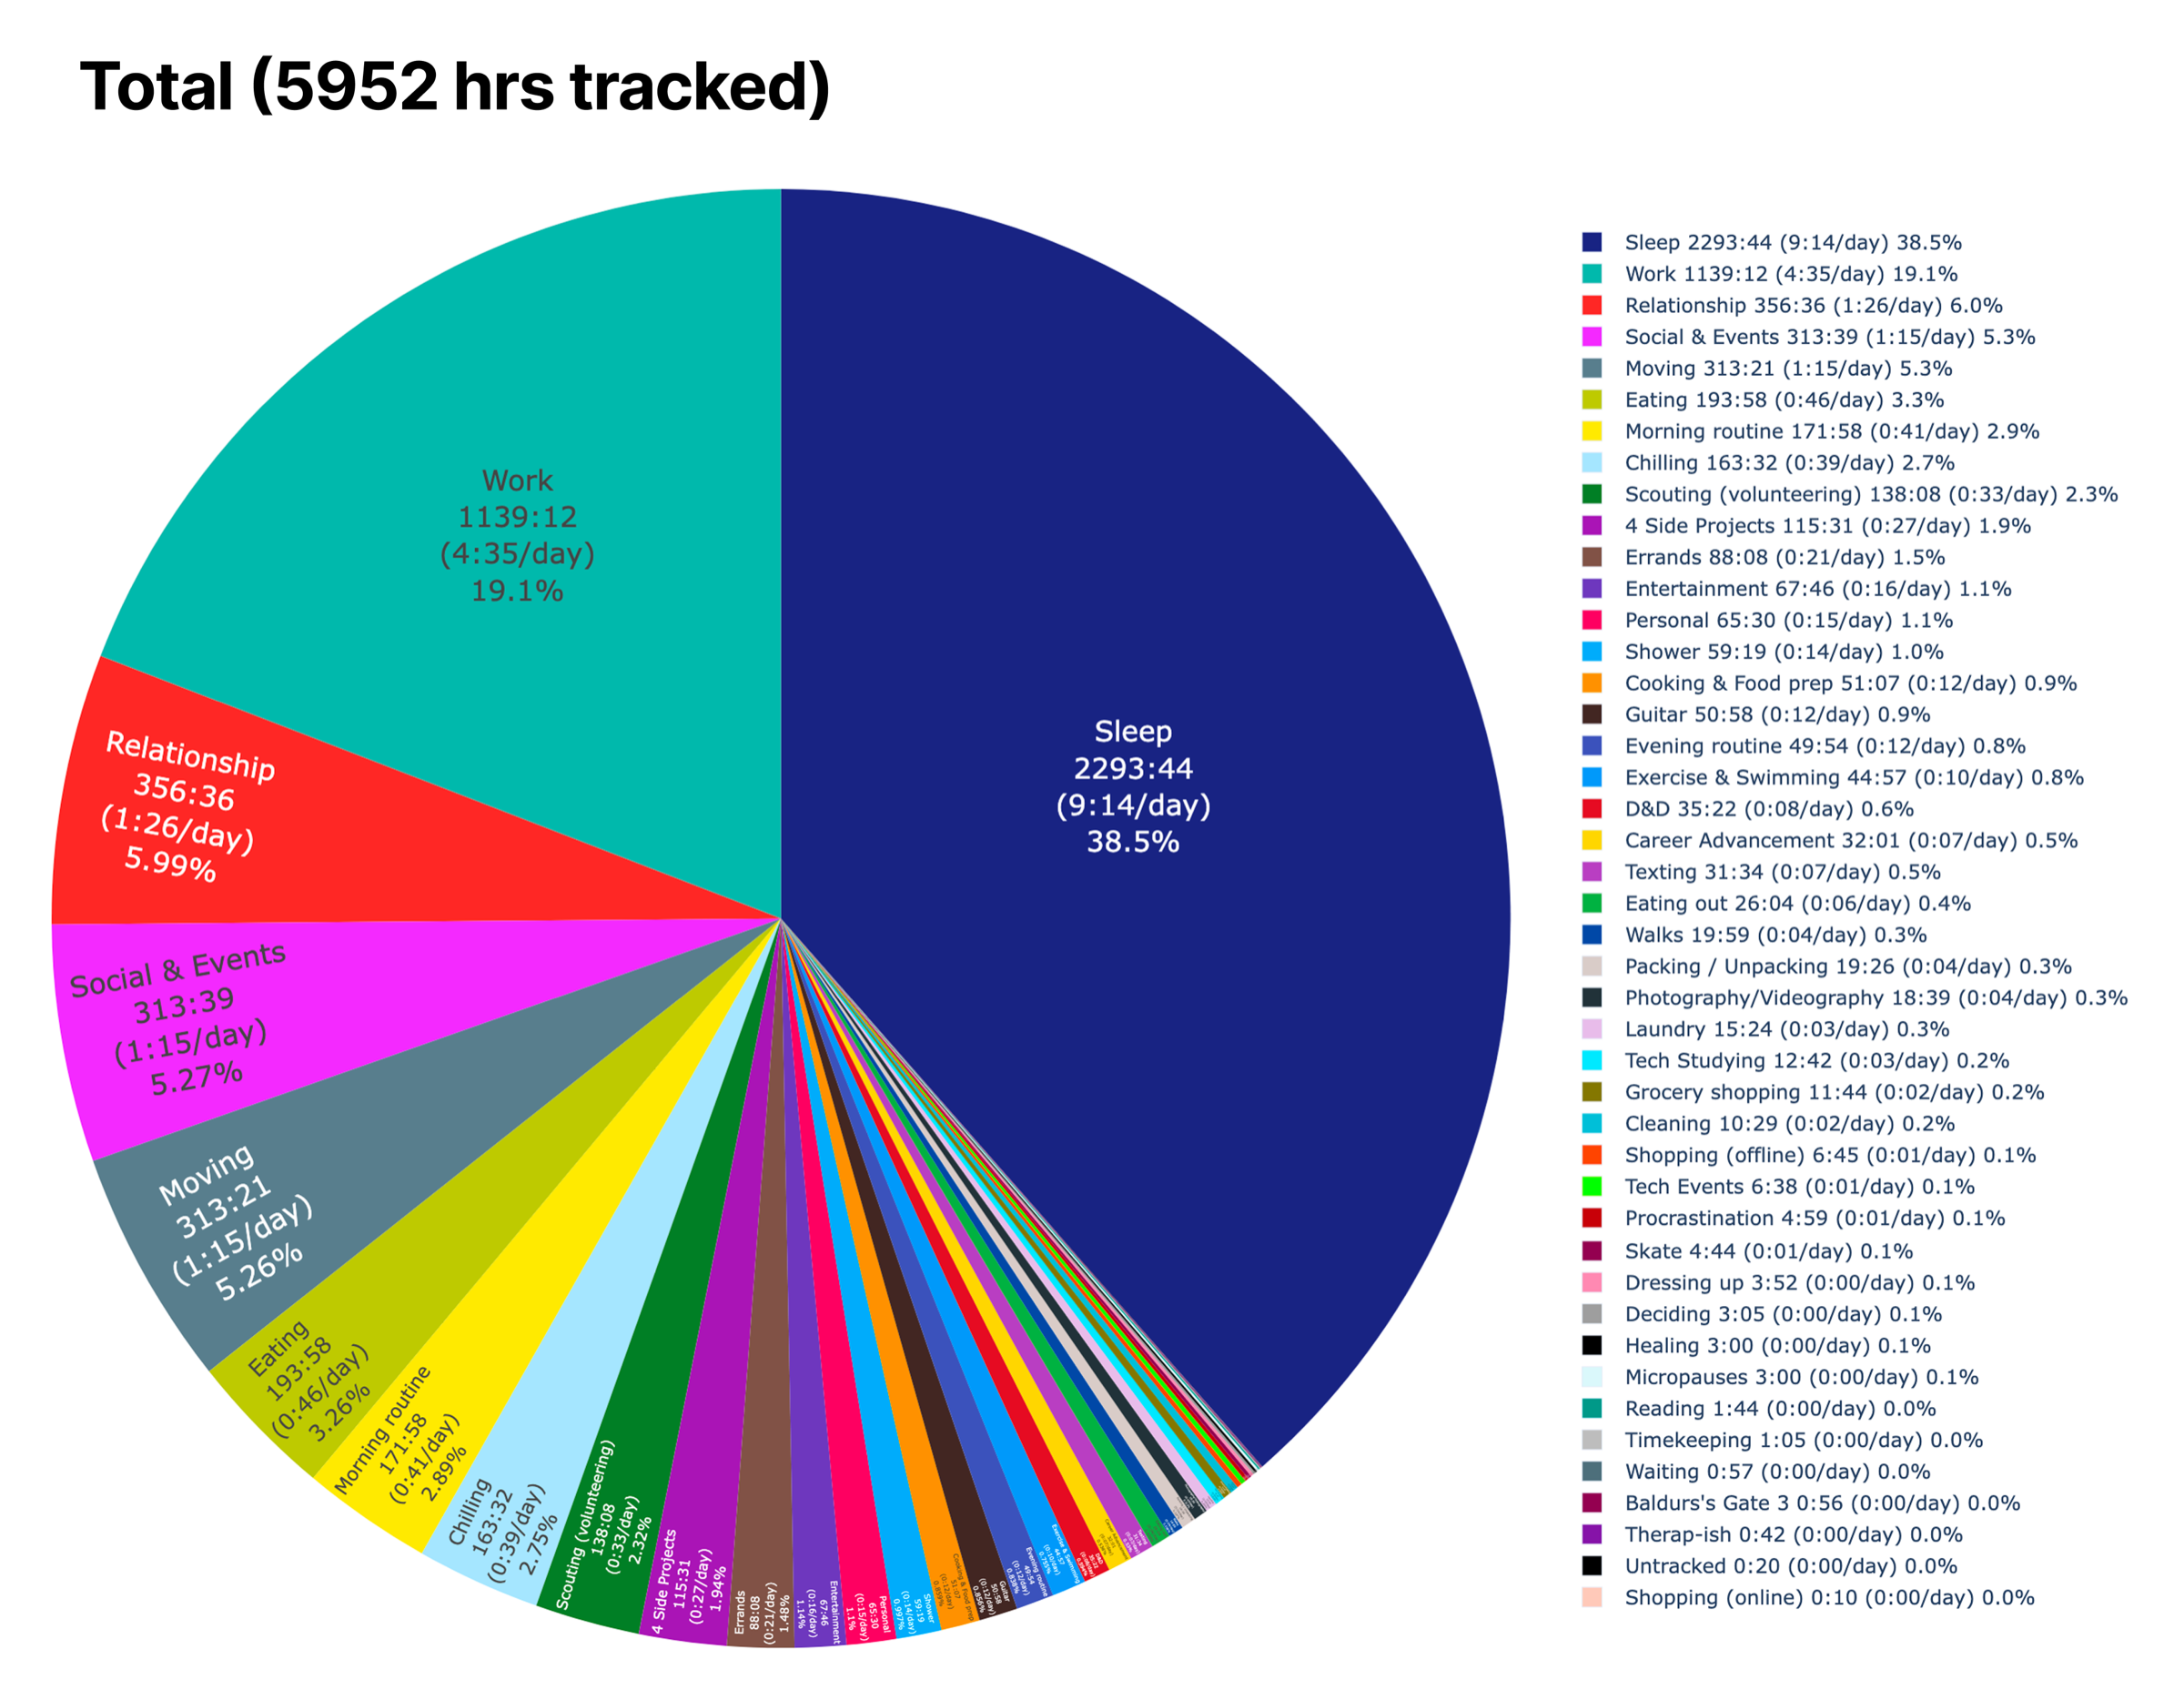
Sleep took 38.5% of everything I logged and work took 19.1%. The rest was spread over dozens of small categories, and the average is calculated per tracked day. Here are my ten biggest:
| Activity | Hours in 2025 | Per day | Share |
|---|---|---|---|
| Sleep | 2,293 | 9:14 | 38.5% |
| Work | 1,139 | 4:35 | 19.1% |
| Relationship | 357 | 1:26 | 6.0% |
| Social and events | 314 | 1:15 | 5.3% |
| Moving (commute and transport) | 313 | 1:15 | 5.3% |
| Eating | 194 | 0:46 | 3.3% |
| Morning routine | 172 | 0:41 | 2.9% |
| Chilling | 164 | 0:39 | 2.7% |
| Scouting (volunteering) | 138 | 0:33 | 2.3% |
| Four side projects (combined) | 116 | 0:27 | 1.9% |
What did I learn from my own time data?
Three things stood out, and they changed what I do.
I sleep a lot, and the schedule matters more than the duration
I knew I slept a lot, but seeing it as a chart put it in perspective: 9 hours 14 minutes a day on average. The thing to fix was not the number of hours but when I went to bed.
The 8-8-8 split is not real
The idea that you sleep a third of your life, work a third and have a third free does not match my data. Just being alive takes a lot of overhead: commuting, meals, routines, errands. The real remainder is much smaller than eight hours, so do not pressure yourself to turn all of it into hobbies and learning. I break the maths down in the 8-8-8 rule is a myth.
Doing too many things fragments your time
In 2025 I ran four side projects, volunteered and kept up several hobbies. Spread that thin, none of them got very far. I want to drop some of them while keeping some variety. More on that in how to find time for a side project when you work full time.
How did weekdays and weekends differ?
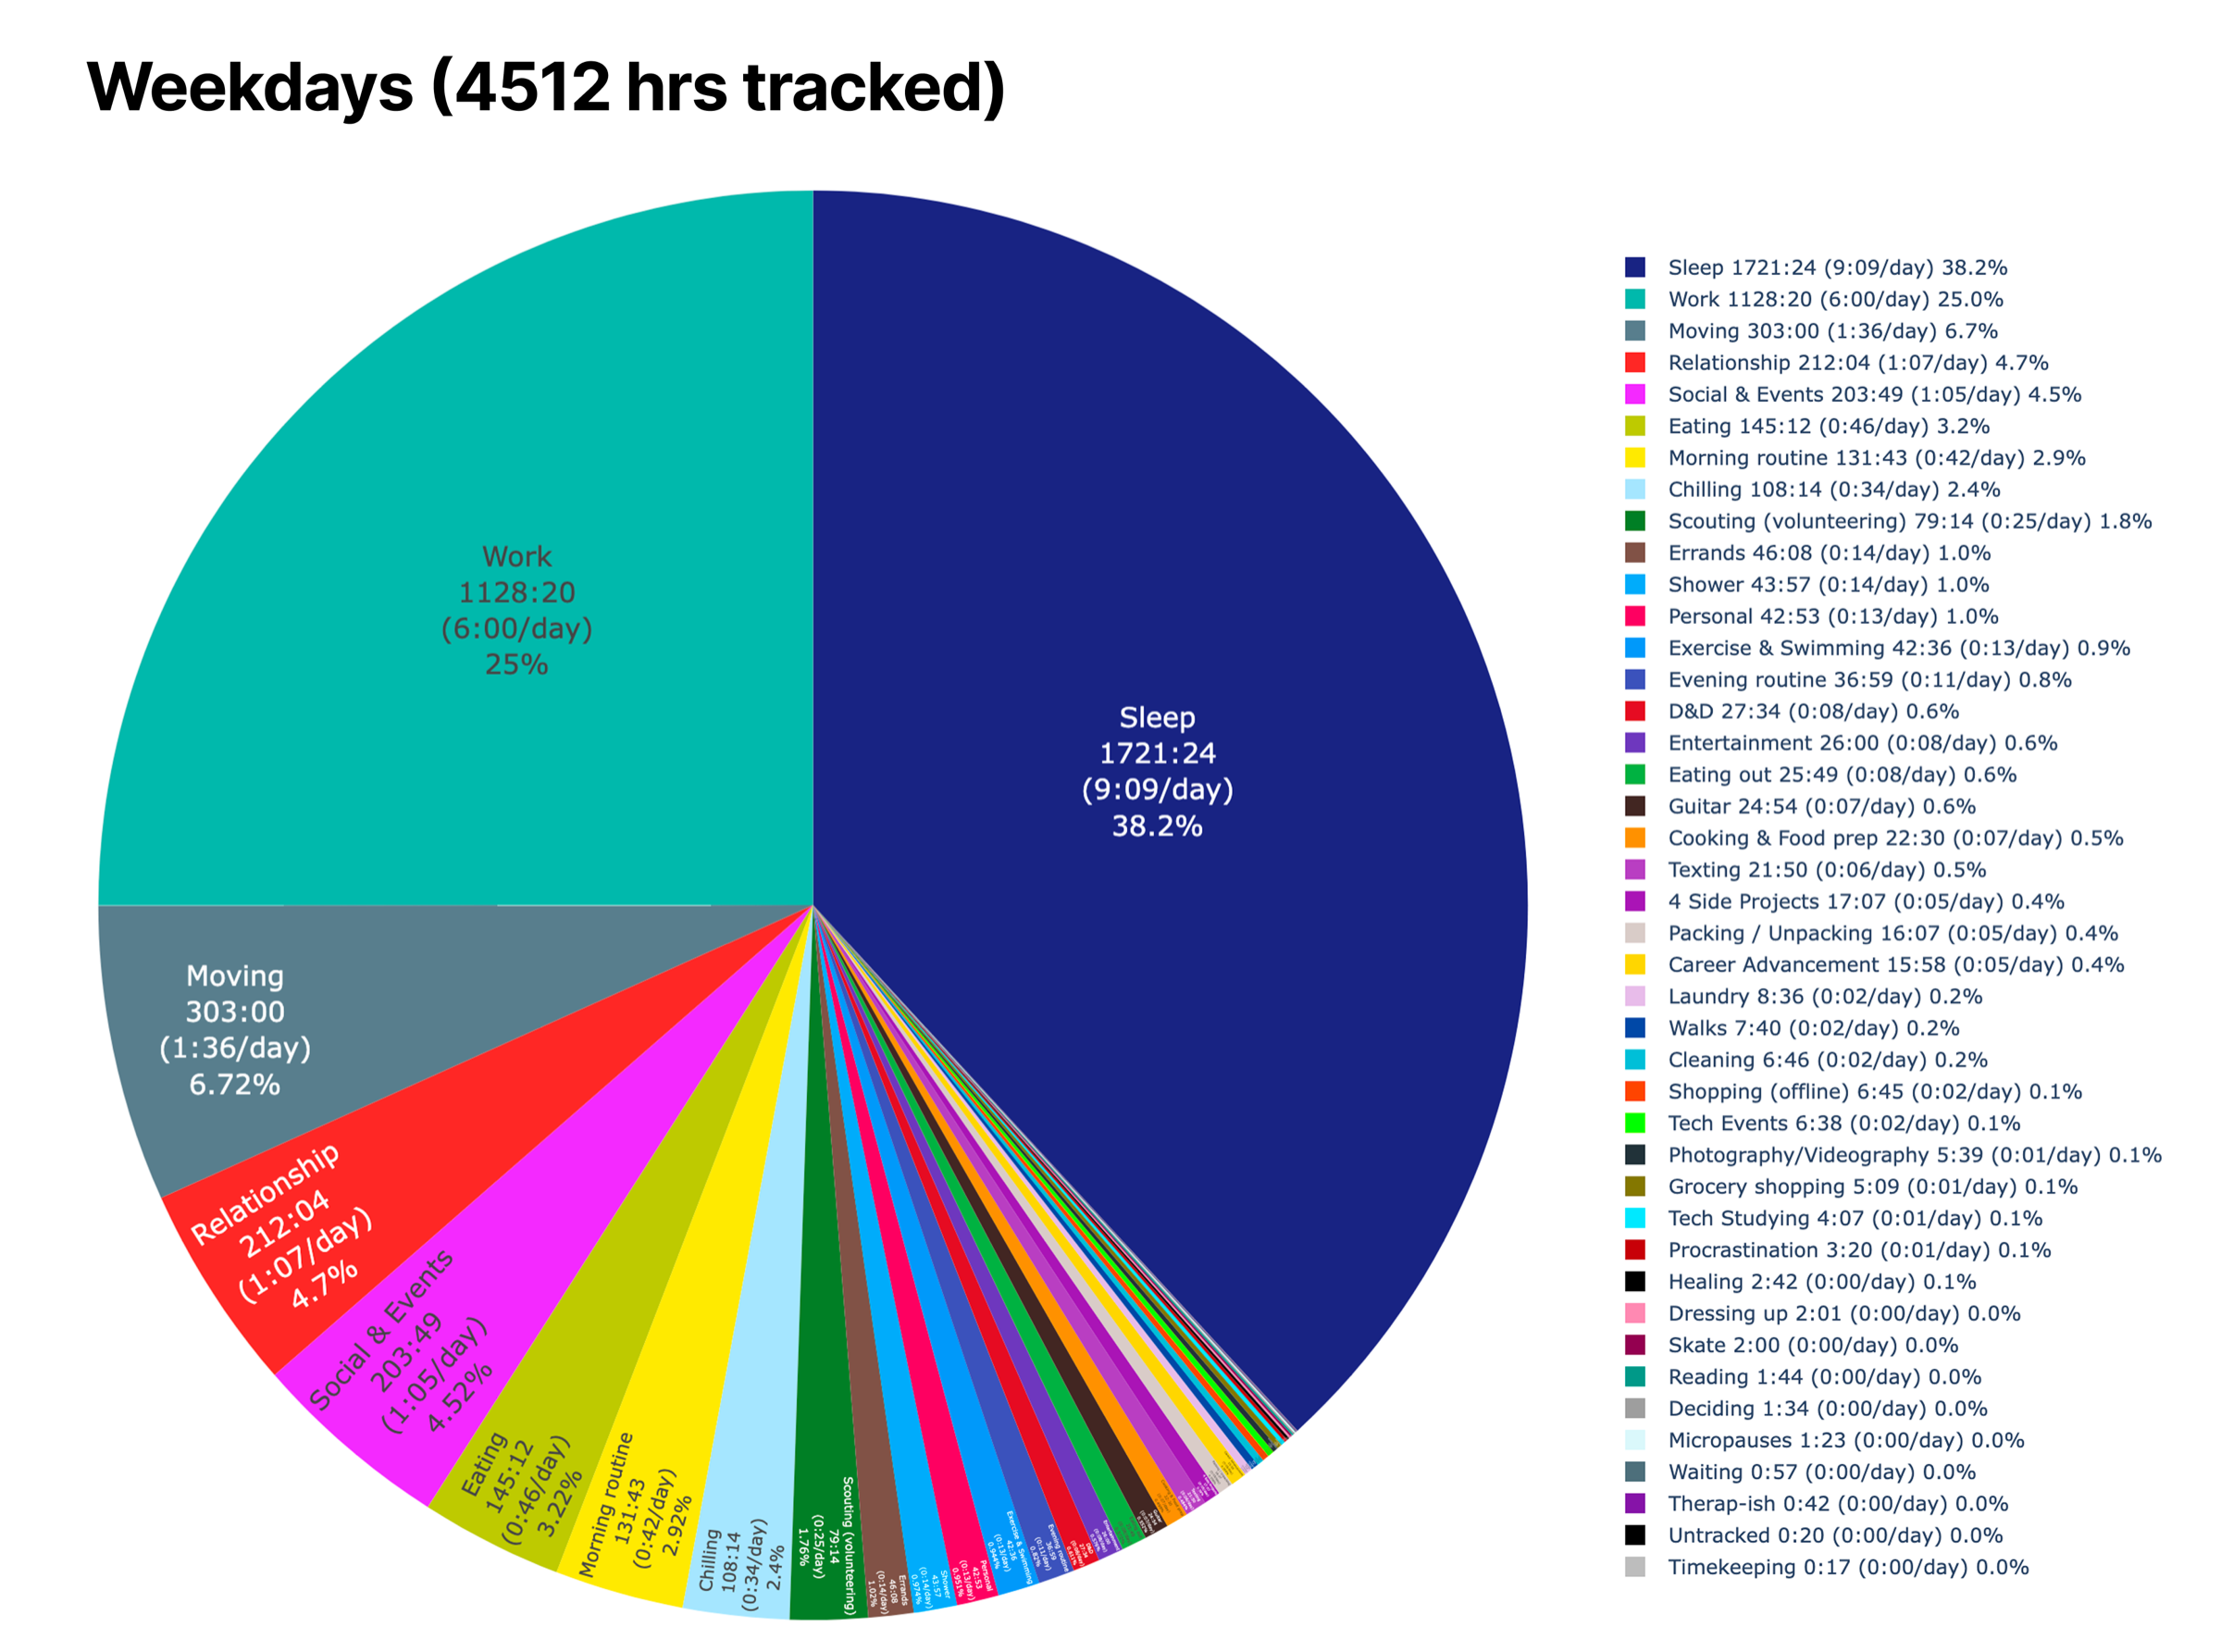
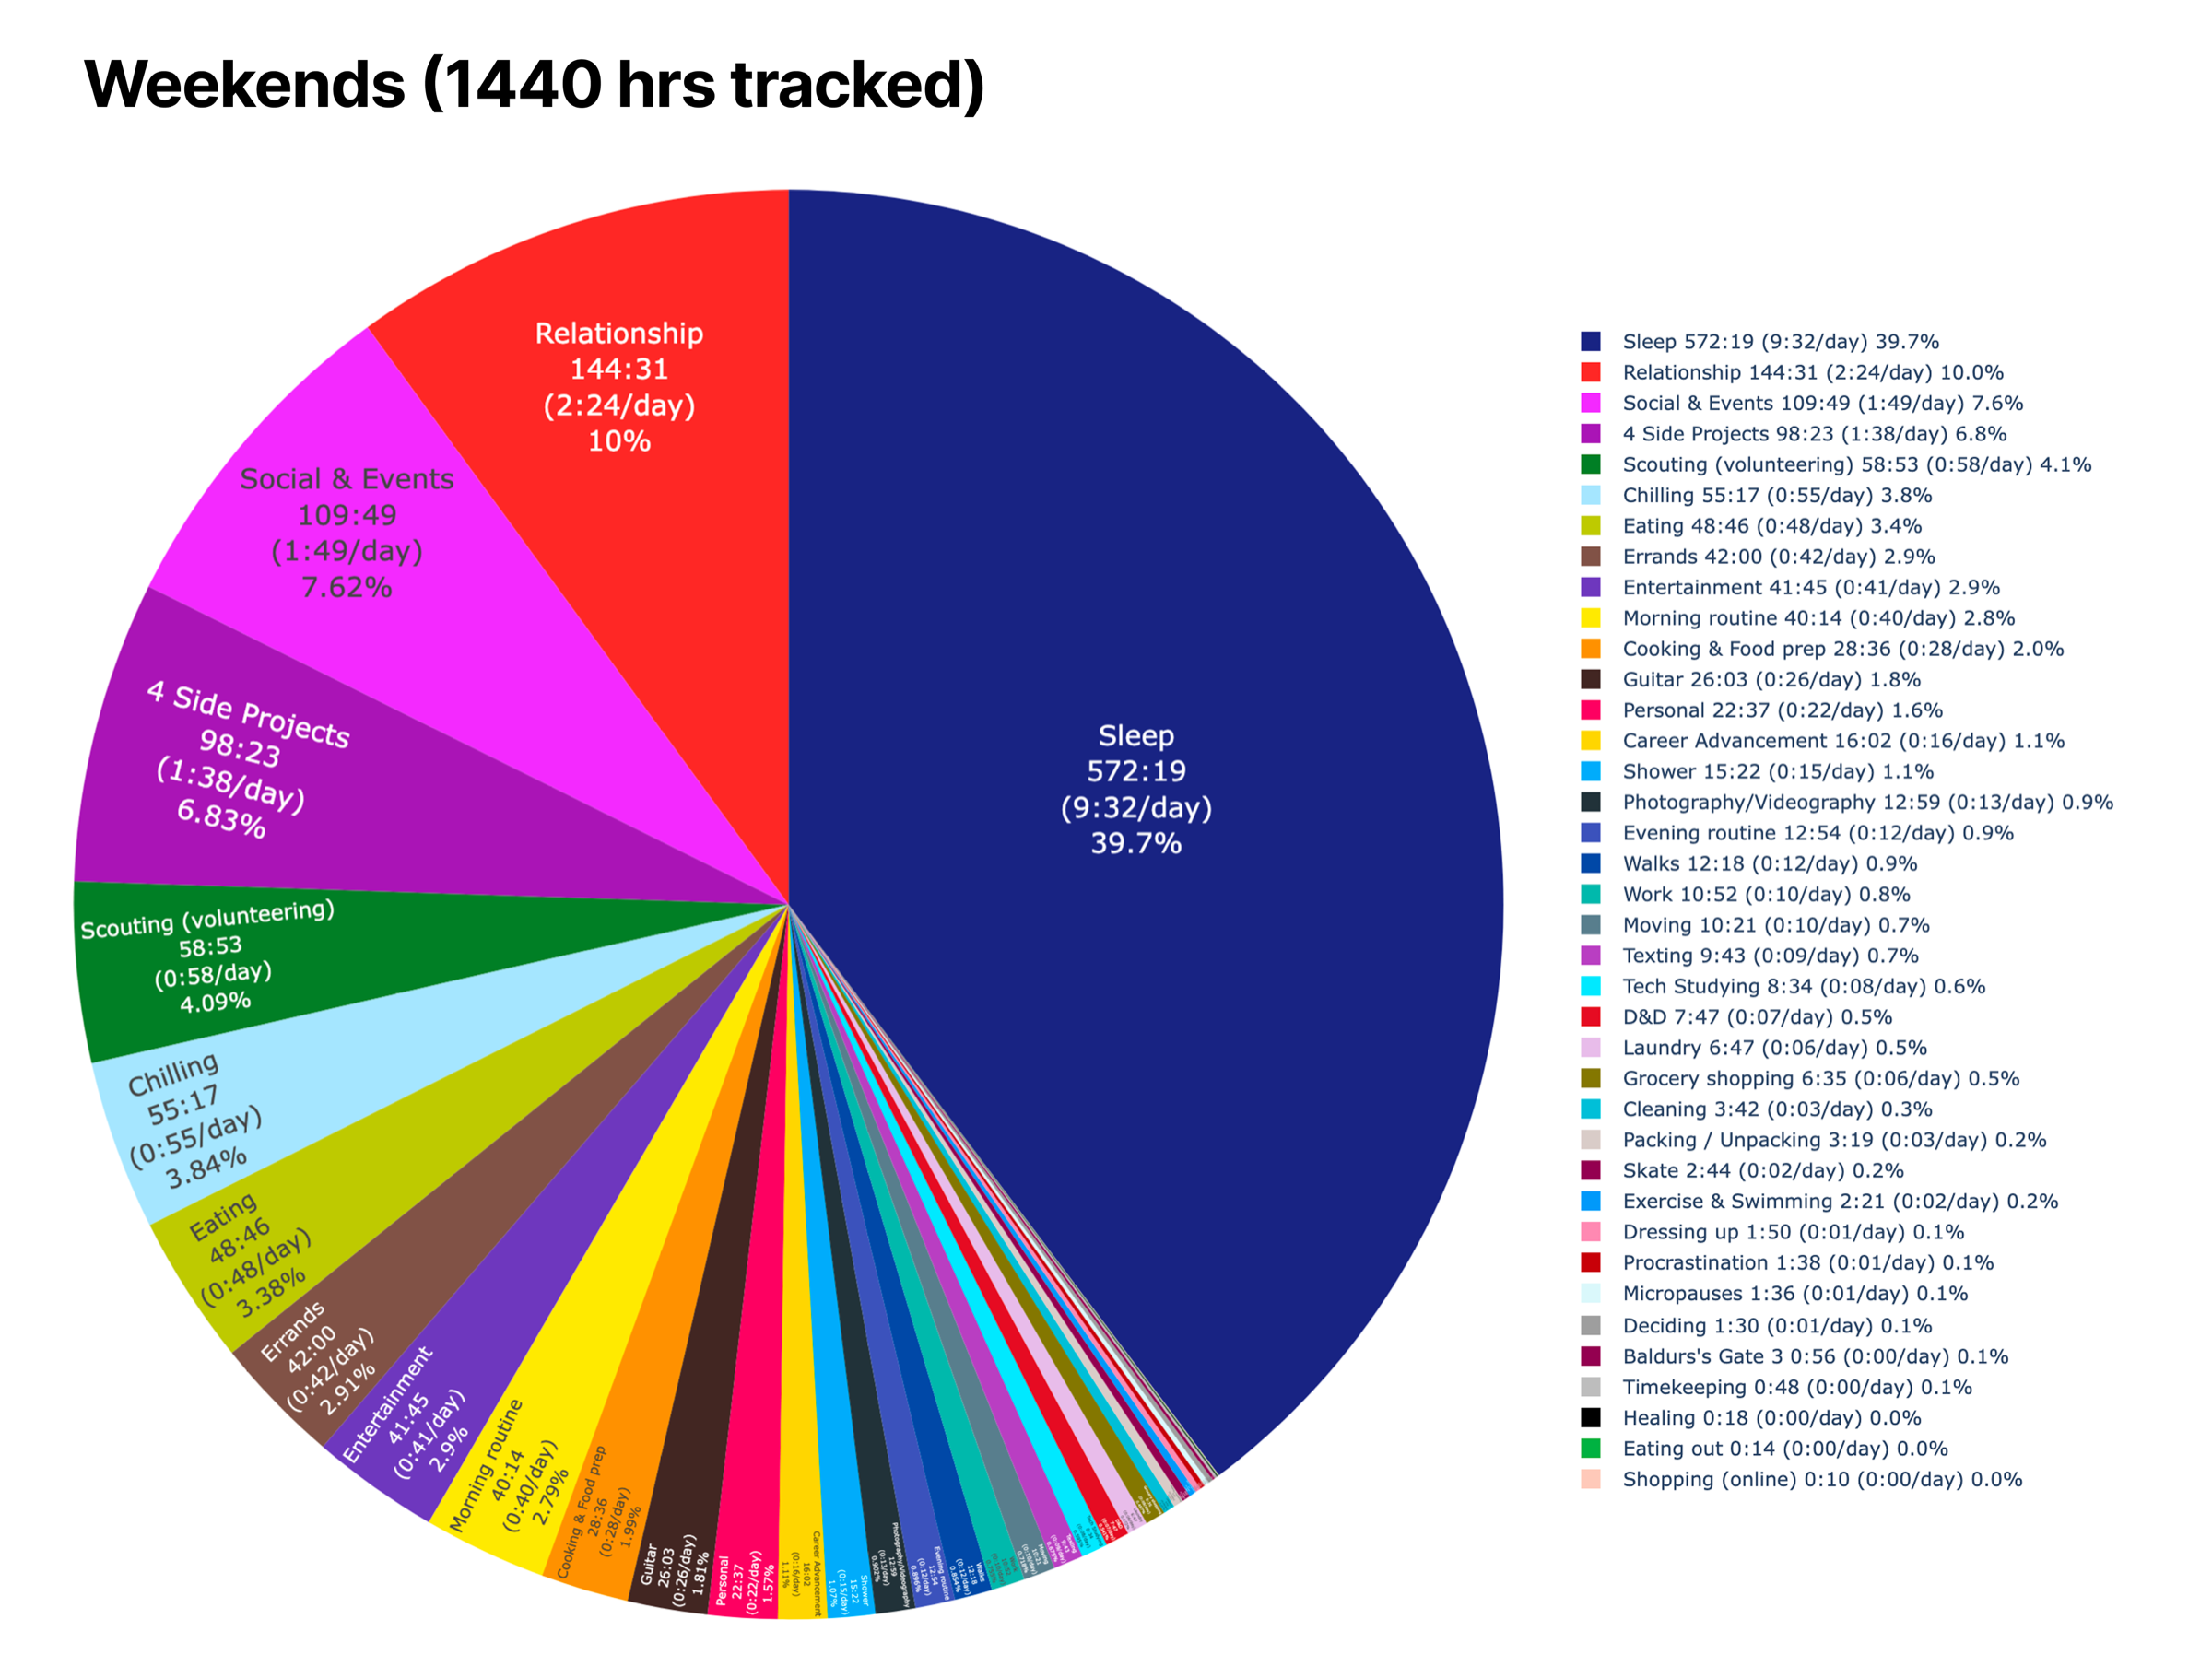
Weekdays were work and commuting; weekends were relationships, friends and projects. I worked 6 hours a day on weekdays and 10 minutes on weekends. My four side projects got 5 minutes a day on weekdays and 1 hour 38 minutes a day on weekends.
| Activity (per day) | Weekdays | Weekends |
|---|---|---|
| Sleep | 9:09 | 9:32 |
| Work | 6:00 | 0:10 |
| Moving (commute and transport) | 1:36 | 0:10 |
| Relationship | 1:07 | 2:24 |
| Social and events | 1:05 | 1:49 |
| Four side projects | 0:05 | 1:38 |
How did my categories change along the way?
I started with a category called Micropauses for the dead time between activities: deciding what to do next, checking messages, switching focus. It turned out to be a bad idea. Running that timer made me procrastinate, because it validated the idea of “dead time”, and it never told me anything useful.
Now I put the one to three minutes of overhead into the current or next activity. For the times I get stuck deciding things, like how to arrange my day or what to eat for lunch, I created a separate Deciding category. It added up to just over three hours in the whole year.
Granularity is a choice. I tracked showering separately (14 minutes a day) but lumped most chores into one category. If you want to choose yours deliberately, see how to do a personal time audit.
Why did I build Nanominute?
My Toggl setup worked, but it took a lot of setup and had quirks: three separate pieces, a midnight workaround that sometimes failed, and a tool built for work rather than for life. Early in 2026 I left my job to build the tracker I actually wanted, and that is Nanominute.
I’m the person who built it, so weigh my opinion accordingly. I built it for my own pain point, I use it every day, and now I’m sharing it with other people.
If you want to try your own audit first with nothing but a free spreadsheet, the tools I tried are a good starting point. A single week of data is enough to learn something surprising.
Try it yourself
Track your personal time with Nanominute
A time tracker for your whole life, not just work. Start a timer, switch with a tap, and see where your days go. Try it free for 2 weeks on iPhone, Android, Mac, Windows and Linux.


Frequently asked questions
How many hours did you track in 2025?
5,952 hours across 248 days: 188 weekdays (4,512 hours) and 60 weekend days (1,440 hours). I only stopped the timer for travel, multi-day events and when I was sick.
How did you make the charts?
I exported the raw data from Toggl Track and built the charts with a Python script using the Plotly library. I lightly edited them in Figma to add context for the missing days, and grouped some categories (like my four side projects) so the charts stay readable.
Did you track everything you did, even at the same time?
No. I only tracked the primary thing I was doing at any moment. If I ate a meal with friends, it counted as Social, not Eating. That biases the data towards the big categories, but it keeps tracking simple enough to keep up for a whole year.
How long does it take to get used to time tracking?
A few days. At first you forget to switch the timer. After that, the small decision of 'what am I doing now?' becomes a habit and starts to make your days feel more intentional.